

- Published on ·
- Time to read
- 11 minute read
Finding a Memory Leak in Node.js

- Authors
- Name
- Patrick Hulce
- @patrickhulce


Debugging memory leaks is a thorny enough journey to be worthy of a post on its own, but when you stumble onto a memory leak in the language itself, well by golly that's MANDATORY posting time. So here's my account of the tools I use for memory debugging JavaScript, my process for investigating memory leaks in general, and how I tracked down and squashed this particularly pesky one.
The Background
I recently found myself wrestling with a stubborn memory leak in a node.js microservice that proxies requests to a third-party. The request volume there is quite high, and the leak was a cunning adversary. My service was leaking memory like a sieve. It took several hundred thousand requests to notice any abnormal memory consumption on our charts and with a lower traffic service we might have not noticed it at all, but with a product this popular, the telltale signs of memory cliffs were there and a life of blissful ignorance eluded us.
But I was not to be outmaneuvered. With a steely determination and a glass of sweet tea at my side, I set out to investigate this elusive leak. It was a quest that allowed me to revisit old friends like chrome://inspect, Chrome DevTools Heap Snapshots, and WeakRef. The journey was not without its fun surprises either, culminating in the discovery of a bug deep in the heart of node itself.
The Tools
At a high level, I tackle memory leaks with the following process and tools:
- Reproduction - attempt to trigger the leaky behavior in a controlled setting, for HTTP services that's
siegem. - Investigation - export the state of the service's memory using
chrome://inspectheap snapshots and learn what's being retained. - Minification - attempt to reproduce the leak in a highly isolated environment using
WeakRefs and node'sglobal.gcfunction. - Remediation - fix the bug and profit 🤑🤑🤑 (repeating steps 1-3 in various subcomponents as necessary).
siegem
siegem (authored by yours truly 😁) is a configurable load testing tool that offers the power of the ancient and battle-tested siege with the familiarity of curl's command-line options and the power of some basic scripting. Think of siegem as your personal army of curl minions, ready to attack any server you want to push to the limits. It's customization options offer support for complex dependent request chains and authentication too for real-world applicability beyond the single request.
chrome://inspect & Heap Snapshots
Now on to the hidden gem that is chrome://inspect. This nifty little feature, found in your favorite Chromium-based browser (yes, even Edge supports chrome://inspect 😂), is super handy when you're trying to debug any node issue, memory leaks included. Forget about messing with fragile configs or setting up your entire IDE to debug a single command. Anything you can run with node you can debug in Chrome by throwing --inspect-brk on the node command and opening the "Dedicated DevTools for Node" found at chrome://inspect.

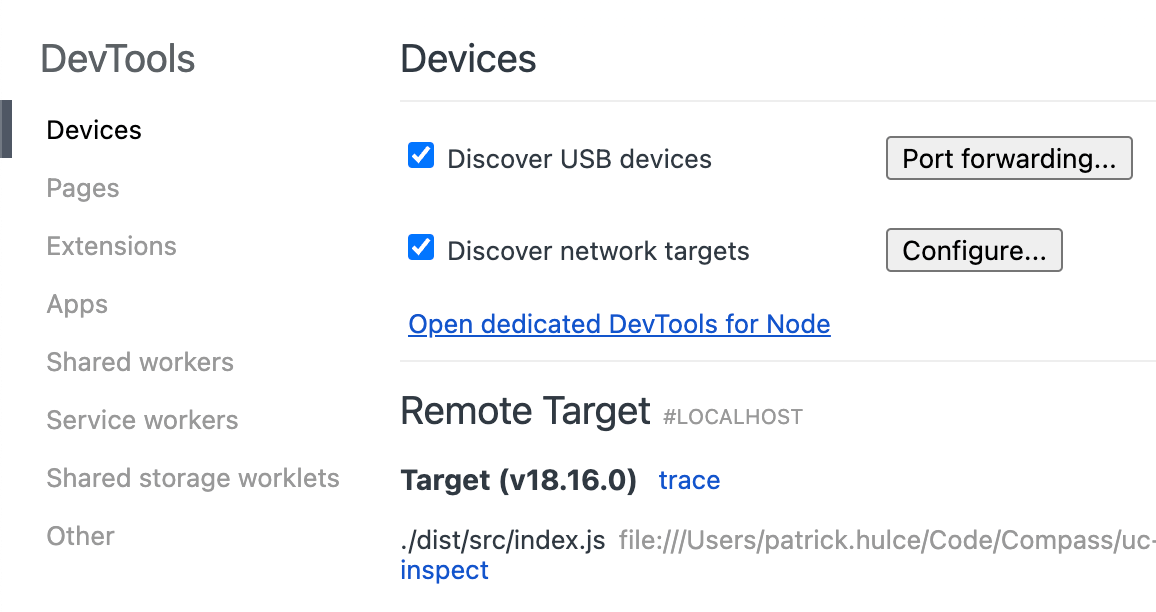
There you'll find the full power of the Chrome DevTools you're already familiar with, including the memory utilities like heap snapshots. Heap snapshots are summaries of your code's memory usage at a specific point in time. They can be instrumental in identifying what is being leaked and what's retaining it. If you're new to the concept, read through Chrome's guide before moving on.

These are incredibly helpful for exploring real-world data from your leaking service, which we'll see put to use later on in this post, but when it comes time to identify the root cause we'll need something a little finer grained. After all, pouring over the ocean with a microscope will only get you so far, at some point it might help to run a few tests from the comfort of your own backyard.
global.gc & --expose-gc
Here's where node's global.gc function and the --expose-gc flag come in. global.gc will forcibly trigger node's garbage collector so you can control the exact timing of this normally unpredictable process. By default, this function is not exposed but throw in --expose-gc to your node invocation, and you'll get a VIP backstage pass to the world of memory management. Combine these newfound powers with a few WeakRef instances wrapping the values you're measuring and you'll be sitting pretty with all the memory measurement chops you could ask for.
function testUsage(thing) {
  console.log('value is', thing.x)
}

function checkGC(weakRef) {
  global.gc()

  if (weakRef.deref() === undefined) {
    console.log('Thing was garbage collected! 🎉')
  } else {
    console.log('Thing was NOT garbage collected! 😞', weakRef.deref())
  }
}

function main() {
  let strongRef = { x: 1 }
  const weakRef = new WeakRef(strongRef)

  testUsage(strongRef)

  strongRef = null
  setTimeout(() => checkGC(weakRef), 0)
}

main()
AbortController
Finally, to grok the leak itself that we'll be examining, we need to cover AbortController and AbortSignal. These are two classes from the Node.js universe that help manage asynchronous operations and cancellation. Because Promises in JavaScript don't natively support the notion of cancellation on their own, AbortController emerged as a standard mechanism for cancelling long-running, asynchronous tasks in JavaScript.
// Create an instance of AbortController.
const controller = new AbortController()
const signal = controller.signal

// Start the fetch request, passing the signal attached to the controller.
fetch('https://api.example.com/data', { signal })
  .then((response) => response.json())
  .then((data) => console.log(data))
  .catch((err) => {
    if (err.name === 'AbortError') {
      console.log('Fetch aborted')
    } else {
      console.error('Another error', err)
    }
  })

// Abort the request after a period of time or in response to user input.
setTimeout(() => controller.abort(), 5_000)
And there you have it, a whirlwind tour of our essential toolkit for debugging memory leaks. Remember, like any good investigation, the key to successful debugging lies in patience, attention to detail, and a healthy dose of curiosity. So, put on your detective hat, grab your magnifying glass, and go hunt down those memory leaks!
In the next chapter, we'll dive deeper into the specific journey of unearthing the leak in my service. Spoiler alert: it was a roller coaster ride! But hey, no one said being a cyber-detective would be easy.
The Investigation
Step 1 - Reproduction
As any good developer worth their salt (or anyone who's read the first half of this post 😉) knows, the first step in investigating a bug is reproducing it. In this case, I needed requests and lots of 'em. I armed myself with siegem and got to work. The goal here was to observe my service's memory footprint after weathering the storm of about one million requests.
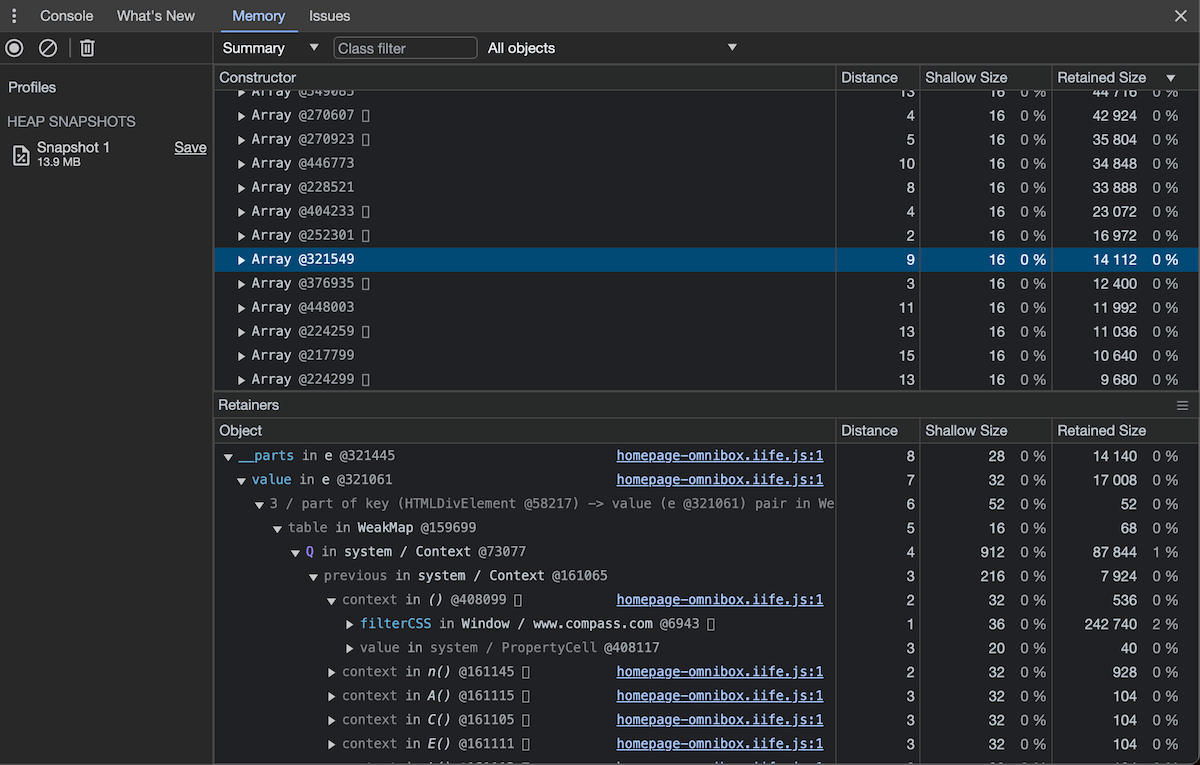
I fired up siegem, pointed it at my localhost with the service running, and waited...and waited...and waited...and waited some more. One million requests later, I spun up DevTools and took a ~400 MB heap snapshot. Clearly we had our leak!
Step 2 - Investigation
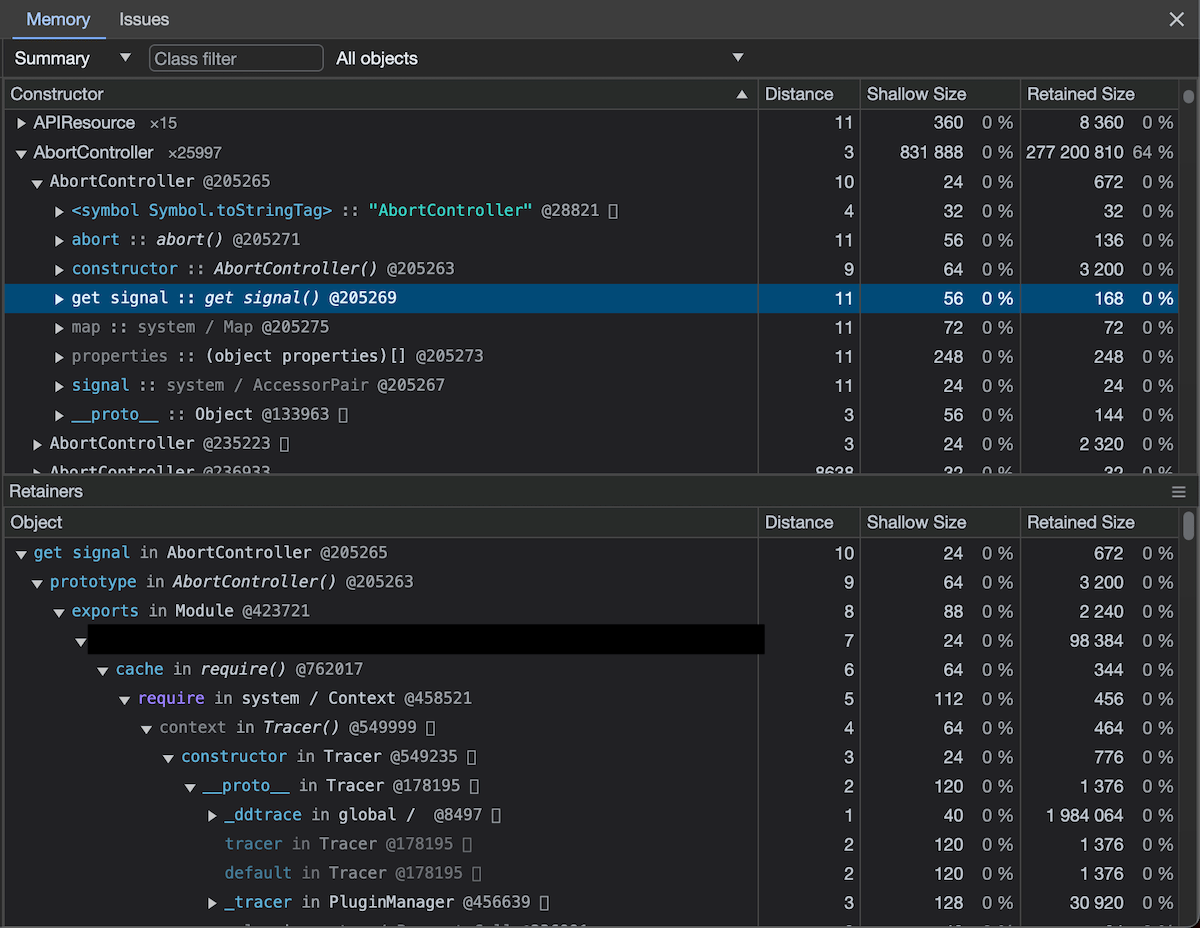
The heap snapshot revealed a rather intriguing finding: a veritable hoard of AbortController objects. The issue became particularly heinous because each AbortController/AbortSignal clung onto everything it referenced in its abort listener, retaining them in memory forever amounting to ~300MB.

Step 3 - Minification
To further dig into this mystery, I decided to construct a small test file that issued a request with a matrix of different request libraries (axios, node-fetch, global.fetch, etc) using an AbortSignal wrapped in a WeakRef. This setup allowed me to see exactly when in the request's lifecycle the signal was being garbage collected (SPOILER ALERT: it wasn't!) and, hopefully, pinpoint the cause of my leak.
What I discovered was as surprising as it was specific. The issue seemed to be present only when using global.fetch, an AbortController, and specifically when I didn't invoke controller.abort(). In other words, when I let the request complete successfully. In this case, the controller was as clean as a whistle and was successfully garbage collected. But that AbortSignal? It lingered like the smell of dirty diapers, refusing to be garbage collected.
I found this particularly puzzling. Why would the AbortSignal stick around when the request, its associated response, and the controller were all able to leave the party?
But that's a tale for the next chapter. For now, minification was accomplished, and the stage was set for the next phase of my investigation: cracking the case.
The Bug
Step 4 - Remediation
Ah, the sweet smell of anticipation in the air! With a minified bug reduced to exclusively built-in JS classes and no libraries involved, I knew I was on the precipice of uncovering a bug in node.js. My palms were sweaty, knees weak, arms were heavy, there's vomit on my sweater already...
With fingers poised over the keyboard and a nervous angst, I updated node to latest and re-ran my minified repro, half-hoping the bug was still there so I could be the hero to all 5 users of AbortController out there, half-praying that it had vanished into the ether so I could end this saga. Alas, the latter proved true. Simply upgrading to v20 had fixed the issue immediately. It was simultaneously a victory and a disappointment; akin to discovering someone else finished your jigsaw puzzle while you were in the bathroom. Yes, the picture was complete, but you're still sad you weren't the one to slot that final piece into place.
The bug may have been fixed, but my curiosity was far from satiated. I needed to know when, who, and what had fixed it. Was it a deliberate patch, or had it been squished inadvertently in the course of other improvements? With my trusty minified repro script in hand, I began a bisect of the intervening Node versions.
In short order, my script pointed me towards node 18.17.0. A quick look at the changelog, however, left me scratching my head. There were no standouts, no trumpet-blaring announcements of a bug fix. I dug deeper still into the deps and found my answer. node@18.17.0 contained an update to undici@5.22.1, a from-scratch HTTP client implementation that node uses for its network requests. In that changelog, an unassuming "fix leak" commit produced our fix:
const acRef = new WeakRef(ac)
const abort = function () {
  const ac = acRef.deref()
  if (ac !== undefined) {
    ac.abort(this.reason)
  }
}

signal.addEventListener('abort', abort, { once: true })
And so, with the bug finally unveiled and the mystery solved, we conclude our adventure. Well, at least you're part of the adventure; I'm still off figuring out how to deal with the other 40% of memory consumption leaks in private 😭.
It's been a fun journey, and I hope it's left you with a newfound appreciation for the complexity and beauty of the art of memory debugging. Until we meet again on another post, happy coding!