

- Published on ·
- Time to read
- 11 minute read
Lighthouse: A History

- Authors
- Name
- Patrick Hulce
- @patrickhulce


For the past 5 years I've had the great honor of working on the Lighthouse team. Lighthouse is an open source tool, backed by Google Chrome, that provides automated advice to web developers on how to improve their site's performance, accessibility, SEO, Progress Web App attributes, and general development best practices.
I owe a great deal of my career acceleration to the success of this project, and as I'm staring down the prospect of leaving my startup, consulting work, and daily open source involvement behind, I'm getting nostalgic for all the great times it's brought me. In this post, I'll dive into my Lighthouse journey and some of the fun milestones the project has had along the way.
Lighthouse Today
Google Lighthouse has become the de facto web performance measurement tool and is widely used by web developers, designers, and marketers. Its popularity can be attributed to the simple fact that it gamified and demystified a once opaque and challenging area of web development: performance measurement. People have become so enamored with Lighthouse that they brag about their 100 scores on Twitter, and even build entire leaderboards around it.
Give Lighthouse any URL and in under 30 seconds its magic will provide a comprehensive and interactive report that assesses scores across 5 categories, rates Good/Ok/Poor evaluations for more than 100 audits, measures performance metrics, and provides quantitative estimates on the value returned for each potential action item.
Because of this simplistic power, Lighthouse has become a ubiquitous tool in the web development ecosystem and is even the foundation of several other performance tools as well. From Chrome DevTools to WebPageTest to SpeedCurve and many others, Lighthouse is used by more than a million monthly active users, and this number continues to grow.
In fact, Lighthouse has become so popular that it has branched out into a family of initiatives, including Lighthouse User Flows, Lighthouse CI, and a revamped PageSpeed Insights. These initiatives have all been designed to help site owners optimize their websites in every environment from local development and continuous integration to production field data, and have cemented Lighthouse's status as king of web performance measurement for the masses.
The Beginning
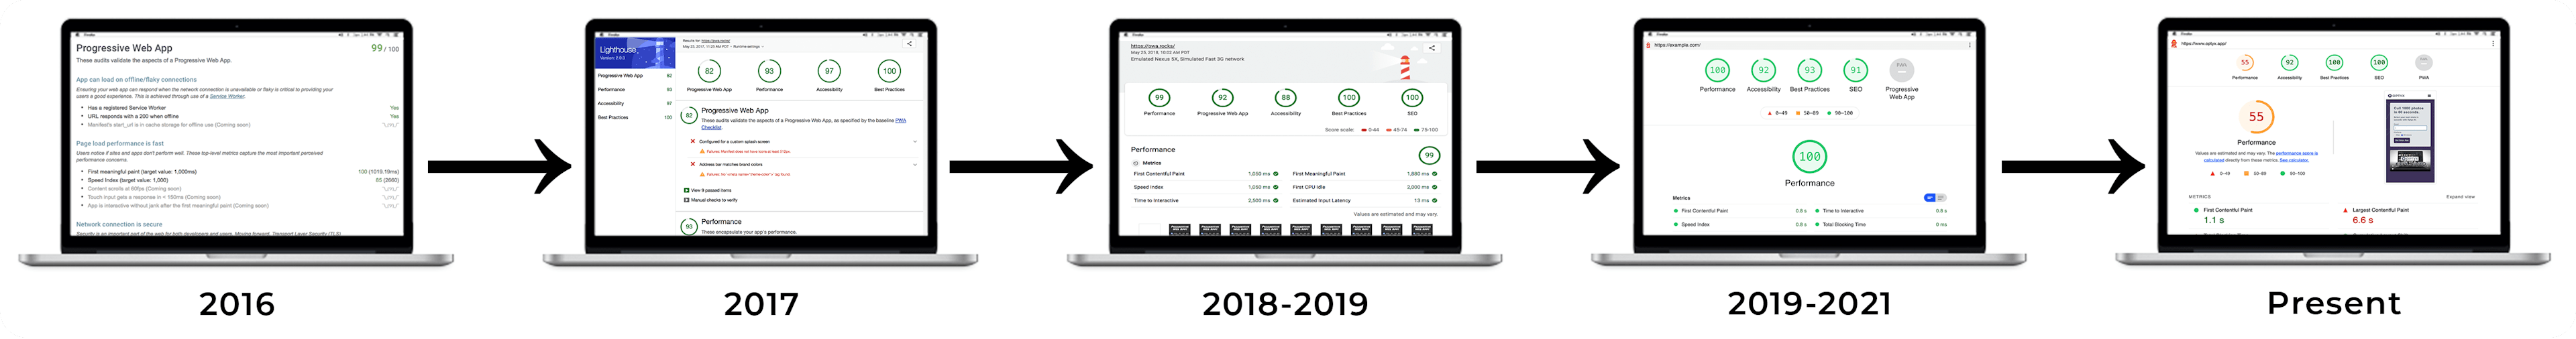
It wasn't always that way though! When Lighthouse first started in 2016, it was just a progressive web app validator, and it looked very different from the comprehensive and detailed tool we know today. Throughout 2016, Google and the Chrome team had launched a major push for Progressive Web Apps (PWAs). The idea behind PWAs was to make web applications more powerful, reliable, and engaging by leveraging modern browser technologies and capabilities. PWAs were seen as a way to bridge the gap between traditional web applications and native mobile apps, and Lighthouse was going to help developers get there.

When I joined Google in November of that year, Lighthouse was a tiny project with only a few hundred DAUs, most of whom were probably Google employees 😂. At that point, there wasn't even a dedicated Lighthouse team of engineers. It was just a neat side project from web legends like Paul Irish. Whenever I got to work on Lighthouse in those early days, I felt like I was stealing time away from my "real job" on Chrome, but boy did I love it!
Despite its humble beginnings, Lighthouse quickly gained traction among web performance enthusiasts as an experimentation playground. By early 2017, Lighthouse began to pick up steam for being one of the first tools to implement bleeding-edge performance metrics that Chrome performance engineers were experimenting with. In fact, the code for these new metrics was available in Lighthouse (written by yours truly 😁), even before they were available as experiments in Chrome!
By mid-2017, we had become part of Chrome DevTools itself and established a proper team. I still remember one of these early pivotal moments in Lighthouse's evolution, a discussion that took place on a whiteboard in B43, the heart of Google's Mountain View campus. It was in this meeting that we debated the creation of scored categories, how they would be evaluated, and what they should contain. This critical step was instrumental in shaping the direction of Lighthouse, promoting performance to the forefront, and laying the groundwork for the comprehensive and detailed experience that was soon to come.
The Inflection Point
As Lighthouse rose in popularity, conversations with the Search team began about integrating Lighthouse into PageSpeed Insights. The collaboration would supplement Google's web performance advocacy strategy, providing more developers with access to valuable performance insights and further encouraging high quality experiences from the search results page (better experiences = more browsing = more ad revenue).
There was just one major problem: Lighthouse's own performance. The irony was not lost on us. In order to compute performance metrics as they would be measured on a real mobile device, Lighthouse had to apply throttling to the page similar to the conditions on an average mobile phone. If you are at all familiar with the performance characteristics of most mobile websites, you know that's a huge problem because the mobile web is slow, like HELLA slow. That's why we were building Lighthouse in the first place!
While this applied throttling and observation approach was necessary to calculate our metrics, it also meant that Lighthouse reports on slow websites like CNN could take almost three minutes of wall time. This was a non-starter for Search, as the excess compute needed for latency that extreme at the scale of the internet crawl was simply not feasible.
Lighthouse needed a way to provide our results without actually slowing down the load of the page. That's where I came in. I was absolutely convinced that we could predict the performance metrics of a page using an unthrottled version of the page's data. An engineer didn't need a mobile phone and 3 minutes to tell you that CNN page was going to be slow, why did Lighthouse? I wanted to use the same principles here. Instead of applying the throttling directly, Lighthouse could observe the page's characteristics as it loads, which resources it needed in what order, how large they were, etc, and then logically replay it later, simulating the throttling after the fact. With this approach, we could even generate estimates for many different types of hypothetical devices using a single page load!
As excited as I was, there was a good deal of skepticism around this idea from the surrounding DevTools team. A similar project had been attempted by some of Chrome's most senior engineers (an L7, 2 L6s, and an L5, I think?) to predict how changes to Chromium logic would affect page performance, but they abandoned the project after a year or more of work due to the complexity involved in maintaining accuracy. How was I going to do any better alone?
Undeterred, or perhaps just a little too stubborn, I put together a proposal and got to work on a prototype (design document if you're curious). I was determined. Even if the last project had failed with a similar approach, at the very least, our situation was different. We didn't need to be as precise. Natural variance in page load and a 0-100 log-normal scoring function already obfuscates a great deal of precision from Lighthouse results, getting in the right ballpark was sufficient (we round to tenths of a second anyhow!). I knew this was going to work.

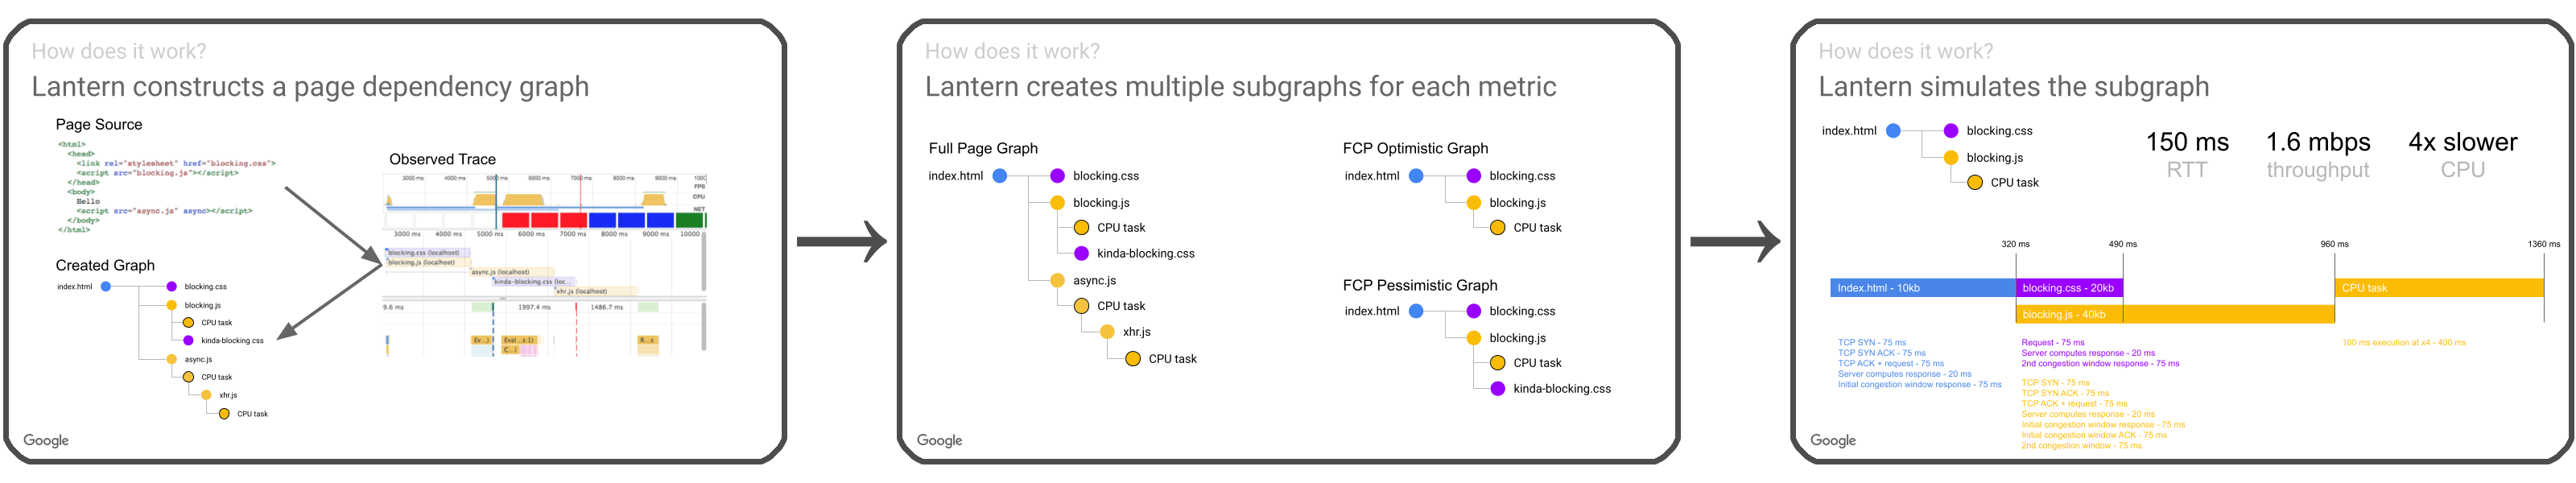
A few weeks later and the results from larger scale cluster tests started rolling in, success! The prototype achieved a Spearman's Rho of .904 on our headline metric, time to interactive, which was just above our stretch goal of .9. Given that Lighthouse results for a page only correlated with themselves at the time at .93, this was a fantastic outcome. We continued some larger scale validation and testing over the next few months before rolling it out, and by Google I/O the following year, we were ready to turn it on by default. Now it just needed a name, Project Lantern had arrived.
In brightest day, in darkest night,
No jank shall escape its might!
Let those who shun performant sites,
Beware its power, Lantern's light!
With Lantern in place, a collaboration with search was unlocked and Lighthouse really took off. Google I/O 2018 will always stand out to me as a particularly exciting inflection point, people knew Lighthouse before they talked to us. Strangers at the conference recognized the name on my badge from commits and wanted to take a selfie with me! Not Paul, me! (Well, of course he wanted one with Paul too, once Paul came back to the booth from his talk 😂) All-in-all, Lantern is still one of my proudest accomplishments in my career thusfar, and it coincided with a tremendous amount of further investment in Lighthouse.
The Expansion
From here Lighthouse continued to expand in scope. The following year brought with it several new team members and a foray into new projects, including Lighthouse CI, a new collection of tools to help track Lighthouse results in continuous integration environments. Even though I had left Google to pursue my startup dreams, I remained involved with the project through contracting agreements with my consultancy and was fortunate enough to lead the entire Lighthouse CI effort from start to finish (that was another fun, memorable conference interaction, "Q: Where's the rest of the Lighthouse CI engineering team? A: You're looking at him!").
As Lighthouse became the go-to tool for web performance measurement over the next two years, the landscape changed radically from my early days. We were no longer the experimentation playground where new metrics land willy nilly. When we make changes now, we make headlines too. With an entire ecosystem of embedders, API consumers, and partners to consider, any changes we made required careful consideration, planning, and communication.
To make matters more complicated, the most ambitious change in Lighthouse's history was yet to come. Removing an invariant foundational to a large, legacy system is one of the most difficult tasks in software engineering, and that's precisely what the team was about to undertake. From its inception, Lighthouse had always analyzed complete page loads. That means the several hundred files that produce the report all assume the existence of a main document, page load events, and comprehensive information about every network request. Now, the team needed to adapt to the next generation of metrics, which analyzed a series of user interactions, not just navigation.
Over the next year, we set to work taking inventory of every dependency Lighthouse had on page load, what would even be possible to provide without one, and the path necessary to get us there. Effectively forking-in-place a large project with hundreds of contributors without disturbing development or requiring duplication was one thing, but what about all of Lighthouse's partners? Chrome DevTools? Puppeteer? What about the dozens of other performance monitoring tools that relied on Lighthouse to run their entire business? Considering the implications for each of them, feedback, and collaboration was a next-level lesson in multi-stakeholder negotiations, and one I actually enjoyed more than I anticipated being a code junkie.
Now, at this point in 2021, we've successfully modified Lighthouse core to accommodate two completely new run modes (a timespan of user interactions AND a point-in-time snapshot of the DOM). Partnerships with DevTools, Puppeteer, and early adopter monitoring venders are underway, and we're well poised for a soft launch in late fall or sometime early next year.
The Future
Unfortunately, it looks as though I will be cheering Lighthouse on from the sidelines as a user in 2022. I am immensely proud of how far we have come, from the experimental playground of my early days to the web performance measurement tool of choice. The challenges we faced, the controversial decisions we debated, and the impact we have made together on the web as a whole have made this experience truly unforgettable.
Of course, I can by no means take personal credit for our successes. It was the result of the hard work and dedication of an incredibly talented team of contributors who shared a passion for building something that could make a real difference in the world, or at least our webby corner of it. I feel privileged to have worked alongside such a fantastic group of people and have no doubt that they will continue to push Lighthouse to new heights.
As I move on to the next phase of my career, I leave Lighthouse with a sense of pride and accomplishment. I would not be where I am today without it. My career may be taking me in a new direction, away from the Lighthouse friends I've made and code I've written along the way, but the memories of this era of my life will be with me forever.